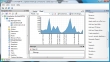
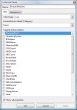
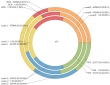
You definitely have to attend Scott Herold’s session (DS-16) at the VMware Developer day or Carter Shanklin’s PowerShell session at the VMworld 2009. In those two sessions you might see the new version of the Virtualization EcoShell 1.2 in action. Since I’m not attending but delivering a VMware ICM training instead :-( Scott Herold was kind enough to let me do some pre-testing with version 1.2. The upgrade went smooth. The first new feature that stroke my eye was the Chart tab in the Grid. After some customization , I was able to create really cool charts. You can select different types like Area, Column, Doughnut, Line, Scatter, Stacked Area and Stacked Column. The horizontal axes labels hold the category and can be fed by everything that’s measurable. You can also select multiple legend entries.
↧